Search advertising is one of the most effective paid media channels, but it’s also one of the most competitive, hence why it is imperative you monitor campaign performance.
Do you know if your results are in line with industry averages? And what can be done to improve your search advertising results if not?
At LOCALiQ, we’ve analysed the data from thousands of our clients’ search advertising campaigns across Google and Bing to develop exclusive 2021 vs 2022 search advertising benchmarks for 26 industries.

What are search advertising benchmarks?
The benchmarking process involves measuring the performance of your business against that of a similar competitor. Search advertising benchmarks provide insightful standards for you to compare your search advertising results, giving you a better understanding of your business performance and potential. In spite of this, it is key to recognise the true measure of success is more about how your business is converting the leads from your search advertising efforts.
This report contains 2021 and 2022 search advertising benchmark data to help you better assess, manage, and maximise your campaign’s performance. Here are a couple of notes about this report:
- This data within this report was pulled from over 500 advertisers and more than 6,200 LOCALiQ paid search campaigns over the past two years.
- Metrics covered in this report include average cost per click, average click-through rate, average cost per lead, and average conversion rate.
Use this report to inform your marketing strategy and get key data on the performance of search campaigns run by other businesses in your industry.
Average cost per click for search advertising
Cost per click (CPC) is essentially the price you pay for each click your search ad receives. Search advertising is a cost-effective advertising strategy, making CPC a key metric to monitor. Furthermore, if your CPC is too high, you won’t be able to prove a valuable return on investment.
To determine the CPC of your PPC campaign, simply divide the total spend by the number of clicks.
Total Money Spent ÷ Total Clicks = Cost Per Click
For example, if your campaign cost £100 and received 80 clicks, your CPC is £1.25.
Find out how your search advertising campaigns’ CPC compares to the industry averages below.
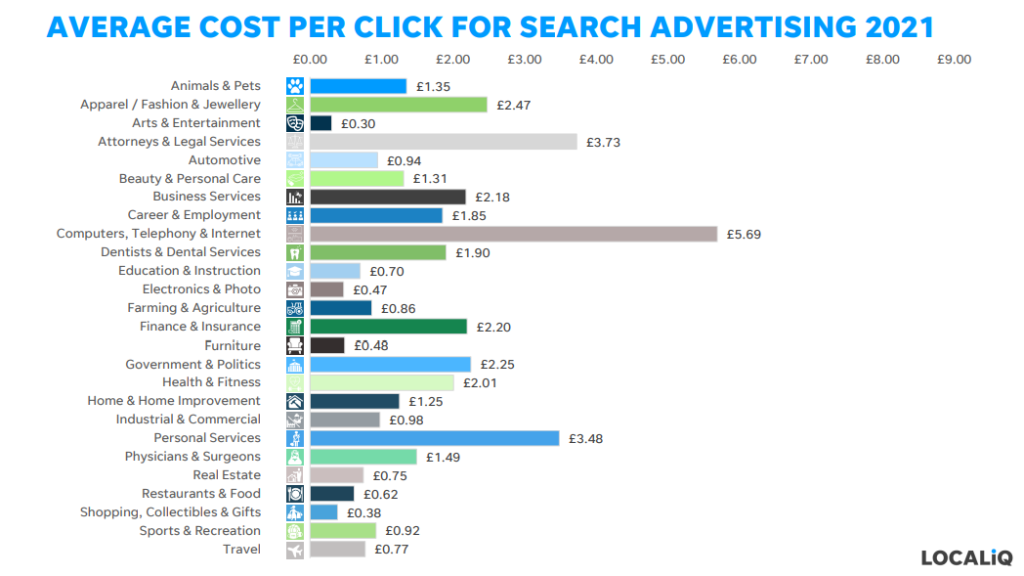
In 2021 the lowest average CPC came from arts and entertainment search advertising campaigns at £0.30, while shopping, collectibles and gifts were close behind at only £0.38 per click.
The highest average CPC came from computers, telephony and internet search advertising campaigns at £5.69, closely followed by attorneys and legal services (£3.73), and personal services (£3.48).

In 2022 the lowest average CPC came from animal and pets at £0.68.
Despite a sizable increase from 2021, shopping, collectibles and gifts search campaigns also received a low average CPC of £0.69.
The highest average CPC came from computers, telephony and internet search advertising campaigns at £8.17, followed by attorneys & legal services (£3.74), and business services (£3.01).

According to the LOCALiQ data, the overall average CPC across all industries in 2021 was £1.54 compared to a slightly higher £1.74 CPC in 2022, giving an average overall increase of 13%.
From the charts above we can see that the computers, telephony and internet industry, and the attorneys and legal services industry consistently saw a higher CPC than other industries over the 2-year period. There is a possibility that this is due to the high cost of keywords in those industries.
Average click through rate for search advertising
Click-through rate (CTR) is a marketing metric used to measure how often people click on your advert. Our UK State of Digital Marketing Report 2023 found when it came to measuring the success of SEO strategies, click-through rate was considered one of the most valuable metrics to track.

CTR is an important metric because it can tell you a lot about what works and what doesn’t work when trying to reach your target audience. It can also help you gauge how well your keywords, ad copy, and images are performing.
A low CTR could indicate that you are not targeting the right audience, are lacking persuasive ad copy, or you’re providing a substandard offer. Whereas a high CTR suggests your ads are performing well and being engaged with by your target audience.
Charlotte Travill, client services team leader for LOCALiQ suggests that “above average (1.9%) CTRs are indicative of ad relevancy, especially on social where CTRs tend to be lower. However, at LOCALiQ we are more reliant on demographic profiling to make sure adverts hit the right audience.”
If you’re interested in demographic profiling use our buyer persona guide and a free template to ensure your ads are personalised to your target audience.
Understanding existing benchmarks and industry averages can help you achieve higher CTRs and reach your business’s goals. Compare your search advertising CTR to the industry averages below.

In 2021, arts and entertainment received by far the highest average CTR at 28.49%, which explains why the industry also received the lowest CPC in that year.
Attorneys & legal services received the lowest average CTR of 3.51% closely followed by personal services (3.52%) and careers and employment (3.56%).

According to LOCALiQ’s most recent data, the average CTR for search advertising across 2022 was 6.4%. However, for example, arts & entertainment ads receive on average a high 17.5% CTR, alongside sports & recreation and education which average an 11%-12% CTR. On the other hand, career & employment ads, and personal service ads receive a low average CTR of 3.2% across 2021 and 2022.
Average cost per lead for search advertising
Cost per lead (CPL) is another essential PPC metric in search advertising because it shows how much you spend for each user to click on your ad and/or contact you in some way.
Our client services team leader Charlotte says “CPL is the biggest indicator of campaign success, it’s the first thing we check when reviewing a campaign.”

In 2021 the average CPL across all industries was £102.85, with computers, telephony & internet being the highest industry overall. Sports and recreation received the lowest at an average CPL of £9.92.

In 2022, the average CPL saw a slight increase across all industries at an average of £104.88. Farming and agriculture saw a huge drop in their average CPL, going from £203.30 in 2021 to £3.95 in 2022, which is the lowest average CPL across all industries. On the contrary, finance and insurance, physicians and surgeons, and travel all saw a substantial increase in average CPL in 2022.
Overall, we found that several industries, including career and employment, dental services, and home improvement had an average CPL below £35 and education and instruction, and sports and recreation below £20. Considering a customer’s lifetime value, these costs are very low, further proving the effectiveness of search advertising.
Average conversion rate for search advertising
The conversion rate is essentially the percentage of website users who take a desired action, such as making a purchase, or responding to a call to action (CTA).
At LOCALiQ “we measure form fills and calls using proxy/tracking numbers with call forwarding, emails, and other “on-click” conversions such as buttons as leads.” Charlotte states that “our lead “value” is either high (a form fill) or medium (a button click). On occasion, we do use low-level conversions but this varies based on the product or service offering.” In this instance a low-level conversion could be a brochure download or a newsletter sign up, actions that don’t necessarily have monetary values associated with them.
In search advertising the conversion rate is often determined by the number of leads you get divided by clicks. The higher your conversion rate, the more effective your content.

*disclaimer – end goals can vary dependent on the campaign type and objective.
In 2021 the average conversion rate across all industries was 3.67%. The highest average conversion rate came from the business services industry at 14.17%, followed by dental services and sports and recreation at 9.3%.
Arts and entertainment, farming and agriculture both received the lowest average conversion rate of 0%, however, it is important to remember end goals can vary dependent on the campaign type and objective.

*disclaimer – end goals can vary dependent on the campaign type and objective.
In 2022 the average conversion rate across all industries was 3.49%, which is a very slight decrease compared to 2021. Interestingly, farming and agriculture went from the lowest average conversion rate in 2021, to the highest average conversion rate of 15% in 2022.
Some industries saw a consistent average conversion rate across both years. Sports and recreation maintained a high average conversion rate of 9%, the animal and pets’ industry also maintained a high average conversion of just below 7%. Conversely, the automotive and furniture industries saw a consistent low average conversion rate of approximately 1%.
Tips to improve search advertising
Although benchmark reports are helpful for identifying what to expect from your business’s search advertising campaigns, it is crucial to also be aware of the various factors, such as, keywords, budget, and more, that can influence the campaign results.
Learn how to successfully run a search advertising campaign.
The PPC experts at our agency shared their top tips for improving search advertising performance. Here’s what they said.
- Choose a campaign goal and keep it top of mind when creating your ad
All campaigns need a goal so you can actively track and monitor their performance and adjust accordingly. You need a clear objective, such as generating leads, increasing website traffic or boosting conversions. Remember that these goals need to be specific and timely.
- Use a PPC planning template
With Google and HubSpot’s PPC Planning Template, you can view how your ads will appear online, see your character counts, and manage your campaigns all in one place.
- Choose keywords with a high search volume and low keyword difficulty
Use an effective keyword tool to help you select keywords likely to drive sales or conversions that aren’t overly expensive. Preferably you want to target keywords which have a high search volume (the number of times a particular keyword is entered into a search engine per month) and a low keyword difficulty (a metric used to determine how difficult it is to rank for a keyword).
- Align your keyword strategy with your bidding
PPC campaigns can get very expensive if they aren’t set up right. To minimise the risk of wasting your budget, you can set a maximum bid cap. You set this bid as the maximum amount to tell Google how much you’re willing to pay when someone clicks on your ad.
There are various other bidding strategies that you can use to control the spending of your budget. Look at the pros and cons of each bidding strategy and select the most appropriate for each campaign.
- Improve your Quality Score
The higher your Quality Score, the better your rank and placements on the Search Engine Results Page. Ainsley McWilliams, LOCALiQ’s Head of Client Services, says “we regularly review Quality Scores on campaign as this is a key indicator of quality and relevance, as well as affecting the CPCs. If we can keep Quality Score as high as possible, this will help keep CPCs low which means we can get more out of the budget.”
- Optimise your ad landing page
The landing page is a major element in directing traffic and gaining leads from your search advertising efforts. Especially as it is the first thing a user will land on after clicking on the search result link. Review these landing page best practices and implement them to increase your conversion rate.
The complete guide to (persuasive) landing pages – with examples.
- Set up an analytics account
LOCALiQ’s customer service team leader, Charlotte Travill, highlights “there are circumstances where lead tracking becomes difficult, so we always encourage clients to set up an analytics account”. Analytics are an important part of any marketing activity, even if it’s only to track website usage from your potential and existing customers. Analytics is a great way to gain a better understanding of your customers, measure your marketing success, and can provide insight on ways to improve your marketing strategy.
- Keep a close eye on the Search Term Report
Another big one to improve search campaigns once they are already set up and running is to keep a close eye on the Search Term Report. LOCAliQ’s Optimisation Analyst, Hayley Carr, says ‘this shows exactly what people are searching for when they see your ads and can be used both to add negative keywords into the campaign to keep your traffic as clean as possible and can be used to identify new keywords’.
Find out how to get the most out of the Search Terms Report.
Interested in learning more about search advertising? Subscribe to our newsletter to stay informed on the latest digital marketing news, trends and updates – or if you want help with marketing your local business, check out our PPC management services or contact us for a free consultation.
Related Articles

How to Optimise for AI-Powered Search: A 2026 Guide for UK Businesses
Prompt Research: The Next Step for AI Search and What UK Businesses Need to Do Now
Non-Commodity Content: What It Is and Why Your Business Needs It
How much does SEO cost in the UK? A 2026 pricing guide
Is Your Business Visible in ChatGPT, Gemini and Perplexity? Here's How to Check