LOCALiQ’s UK State of Digital Marketing Report surveyed more than 500 businesses across the UK, exploring trending marketing topics, challenges, budgets, and marketing goals. This year’s survey offered a treasure trove of data, featuring 500+ individual statistics. Whether you’re curious about satisfaction levels, strategic priorities, technology adoption, or budgets, you’ll find it all here.
Feel free to use and share our stats using the following attribution:
LOCALiQ UK State of Digital Marketing Report 2026
On this page:
- Marketing Satisfaction Trends
- Marketing Training Trends
- Marketing Strategy Insights
- Marketing Platform Stats
- Marketing Performance Statistics
- Paid Search Marketing Trends
- SEO Trends (+infographics)
- Website Marketing Stats
- Content Marketing Trends (+infographics)
- AI in Marketing Trends (+infographics)
- Digital Marketing Trends – Challenges
- Marketing Budget Trends
- 2026 Marketing Goals
- Future Plans in Digital Advertising
Featured Infographics:
Marketing Satisfaction Trends
Are UK businesses satisfied with their marketing performance?
- 1 Star (Very Dissatisfied): 7% of marketing professionals rated their overall marketing performance satisfaction at this level.
- 2 Stars (Dissatisfied): 19% of marketing professionals rated their overall marketing performance satisfaction at this level.
- 3 Stars (Neutral): 51% of marketing professionals rated their overall marketing performance satisfaction at this level.
- 4 Stars (Satisfied): 23% of marketing professionals rated their overall marketing performance satisfaction at this level.
- Average Satisfaction Rating: The average marketing performance satisfaction rating among respondents was 3 out of 4 stars.
Marketing satisfaction across different marketing areas
-
- Social Media Advertising: 67% are satisfied with their peformance, while 19% are not satisfied and 14% marked it as not applicable.
- Cross-Channel Marketing: 49% are satisfied with their peformance, while 29% are not satisfied and 23% marked it as not applicable.
- E-Commerce: 27% are satisfied with their peformance, while 21% are not satisfied and 52% marked it as not applicable.
- Marketing Measurement: 50% are satisfied with their peformance, while 35% are not satisfied and 15% marked it as not applicable.
- Customer Response Management: 53% are satisfied with their peformance, while 27% are not satisfied and 20% marked it as not applicable.
- Content Marketing: 63% are satisfied with their peformance, while 25% are not satisfied and 12% marked it as not applicable.
- Brand Building: 70% are satisfied with their peformance, while 23% are not satisfied and 7% marked it as not applicable.
- Events: 59% are satisfied with their peformance, while 19% are not satisfied and 22% marked it as not applicable.
- Public Relations: 65% are satisfied with their peformance, while 12% are not satisfied and 23% marked it as not applicable.
- Marketing Automation: 42% are satisfied with their peformance, while 36% are not satisfied and 22% marked it as not applicable.
- Digital Strategy: 52% are satisfied with their peformance, while 34% are not satisfied and 14% marked it as not applicable.
- Organic Social Media Marketing: 59% are satisfied with their peformance, while 31% are not satisfied and 10% marked it as not applicable.
- SEO (Search Engine Optimisation): 53% are satisfied with their peformance, while 35% are not satisfied and 12% marked it as not applicable.
- Paid Search (PPC): 42% are satisfied with their peformance, while 26% are not satisfied and 32% marked it as not applicable.
- Website Marketing: 60% are satisfied with their peformance, while 26% are not satisfied and 14% marked it as not applicable.
- Video Marketing: 39% are satisfied with their peformance, while 31% are not satisfied and 30% marked it as not applicable.
Marketing Training Trends
Where are businesses lacking marketing training?
- 32% feel they need more training in SEO (Search Engine Optimisation).
- 26% expressed a need for more training in campaign strategy.
- 29% indicated a need for more training in content marketing.
- 36% feel they need more training in data analytics.
- 25% expressed a need for more training in social media.
- 19% indicated a need for more training in digital proficiency.
- 14% feel they need more training in coding and software development.
- 38% expressed a need for more training in how to optimise for AI-generated search results.
- 31% indicated a need for more training in using AI for automation/agents.
- 28% feel they need more training in using AI for content creation.
- 28% expressed a need for more training in paid search (PPC).
- 16% indicated a need for more training in website design and management.
- 14% feel they need more training in display advertising.
- 21% expressed a need for more training in digital PR.
- 26% indicated a need for more training in video marketing.
- 23% feel they need more training in branding and design.
- 10% expressed a need for more training in listings management.
- 6% indicated a need for more training in print advertising.
- 3% feel they need more training in “other” areas.
Marketing Strategy Insights
Which channels are most widely used in marketing strategies?
- Organic Social Media: 84% of marketing professionals include this in their marketing strategy.
- Paid Social Media Advertising: 57% of marketing professionals use this in their strategy.
- Website or App: 66% of marketing professionals have these as part of their marketing strategy.
- Email Marketing: 61% of marketing professionals use this in their strategy.
- Content Marketing: 62% of marketing professionals include this in their strategy.
- Display Ads: 39% of marketing professionals use this in their marketing strategy.
- Events & Sponsorships: 44% of marketing professionals incorporate these into their marketing efforts.
- Video Marketing: 43% of marketing professionals use this in their strategy.
- SEO (Search Engine Optimisation): 48% of marketing professionals include this in their marketing strategy.
- Direct Mail or Print Advertising: 38% of marketing professionals use this in their strategy.
- Paid Search (PPC): 31% of marketing professionals incorporate this into their marketing strategy.
- Audio or Podcasts: 14% of marketing professionals use these in their strategy.
- TV or OTT Advertising: 5% of marketing professionals include these in their marketing strategy.
- Webinars: 11% of marketing professionals use this as a marketing channel.
- Other: 2% of marketing professionals selected this as a marketing channel in their strategy.
How crucial are these marketing channels and objectives?
- Ease of Finding & Buying Online: 84% say it is important, while 16% consider it not important.
- Adhering to Data Privacy Laws: 95% believe it is important, while 5% say it is not important.
- Compliance with Google’s Guidelines: 93% consider it important, while 7% say it is not important.
- Outperforming Competitors Online: 75% think it is important, while 25% say it is not important.
- Task Automation: 70% believe it is important, while 30% consider it not important.
- Ethical Data Collection & Targeting: 92% say it is important, while 8% believe it is not important.
- Keeping Up with Marketing Updates: 83% feel it is important, while 17% say it is not important.
- Marketing & Sales Alignment: 84% think it is important, while 16% believe it is not important.
- Social Media Marketing: 94% consider it very important, while 6% say it is not important.
- Display Advertising: 66% say it is very important, while 34% believe it is not important.
- E-Commerce: 45% consider it very important, while 55% say it is not important.
- Content Marketing: 82% view it as very important, while 18% consider it not important.
- SEO (Search Engine Optimisation): 86% say it is very important, while 14% think it is not important.
- Paid Search (PPC): 61% find it very important, while 39% say it is not important.
- Website: 92% consider it very important, while 8% say it is not important.
- Online Directories & Listings: 61% say they are very important, while 39% believe they are not important.
- Print Advertising: 62% consider it very important, while 38% say it is not important.
- Digital PR: 75% consider it very important, while 25% say it is not important.
Which digital marketing initiatives are the top priorities for UK businesses in 2026?
- Increasing sales revenue: 62% identified this as one of their three priorities this year.
- Increasing brand awareness: 52% prioritised this as a key focus for the year.
- Increasing customer engagement: 60% stated this is among their top three priorities.
- Reaching new customer segments: 32% listed this as a main priority this year.
- Increasing leads for the sales team: 33% said this is a top priority.
- Reducing costs: 19% are focused on this as a key goal.
- Adapting to changing data and technology standards: 19% stated this is one of their top three priorities.
- Improving marketing automation: 14% identified this as a priority this year.
- Improving marketing and sales alignment: 7% said this is a key focus.
Marketing Platform Stats
Which marketing platforms are currently used by UK businesses?
- Meta/Facebook: 38% use organic advertising, while 11% use paid advertising, 40% use both organic and paid advertising and 11% do not use Meta/Facebook at all.
- Instagram: 36% use organic advertising, while 16% use paid advertising, 26% use both organic and paid advertising and 22% do not use Instagram.
- LinkedIn: 46% use organic advertising, while 4% use paid advertising, 21% use both organic and paid advertising and 29% do not use LinkedIn.
- Snapchat: 2% use organic advertising, while 7% use paid advertising, 4% use both organic and paid advertising and 87% do not use Snapchat.
- TikTok: 21% use organic advertising, while 9% use paid advertising, 5% use both organic and paid advertising and 65% do not use TikTok.
- X (Twitter): 34% use organic advertising, while 6% use paid advertising, 7% use both organic and paid advertising and 53% do not use X (Twitter).
- YouTube: 33% use organic advertising, while 13% use paid advertising, 11% use both organic and paid advertising and 43% do not use YouTube.
- Google: 44% use organic advertising, while 13% use paid advertising, 29% use both organic and paid advertising and 14% do not use Google.
- Bing: 21% use organic advertising, while 7% use paid advertising, 5% use both organic and paid advertising and 67% do not use Bing.
- Threads: 10% use organic advertising, while 3% use paid advertising, 2% use both organic and paid advertising and 85% do not use Threads.
- Other Platforms: 12% use organic advertising, while 6% use paid advertising, 1% use both organic and paid advertising and 81% do not use them.
Marketing Performance Statistics
When analysing their marketing performance, which is the favoured metric for UK businesses?
- Sales: 16% find this to be the most valuable metric when measuring the effectiveness of their marketing strategy.
- Social Media Engagement: 12% believe this to be the most valuable metric when analysing their marketing.
- Website Traffic: 30% feel this is the best metric for assessing marketing performance.
- High Conversion Rates: 16% find this to be the most valuable metric when measuring the effectiveness of their marketing strategy.
- Lead Generation: 13% believe this to be the most valuable metric when analysing their marketing.
- ROI: 6% feel this is the best metric for assessing marketing performance.
- Increased Brand Awareness: 5% find this to be the most valuable metric when measuring the effectiveness of their marketing strategy.
- Other: 3% believe this to be the most valuable metric when analysing their marketing.
Paid Search Marketing Trends
Which marketing platform do UK businesses invest in the most for paid ads?
- Meta/Facebook: 33% invest in Meta/Facebook the most for their paid ads.
- N/A: 21% selected “N/A” for the platform they invest in the most for their paid ads.
- Google Ads: 25% invest in Google Ads the most for their paid ads.
- X/Twitter: 2% invest in X/Twitter the most for their paid ads.
- YouTube: 6% invest in YouTube the most for their paid ads.
- TikTok: 0% invest in TikTok the most for their paid ads.
- Instagram: 7% invest in Instagram the most for their paid ads.
- LinkedIn: 3% invest in LinkedIn the most for their paid ads.
- Microsoft Ads (Bing): 0% invest in Microsoft Ads (Bing) the most for their paid ads.
- Pinterest: 0% invest in Pinterest the most for their paid ads.
- Snapchat: 0% invest in Snapchat the most for their paid ads.
- Other: 3% selected “other” for the platform they invest in the most for their paid ads.
Which marketing platform yields the highest ROAS for UK businesses?
- Meta/Facebook: 36% see the best ROAS from Meta/Facebook.
- TikTok: 1% see the best ROAS from TikTok.
- Google Ads: 25% see the best ROAS from Google Ads.
- Instagram: 7% see the best ROAS from Instagram.
- X/Twitter: 7% see the best ROAS from X/Twitter.
- YouTube: 6% see the best ROAS from YouTube.
- N/A: 9% selected “N/A” for the platform with the best ROAS.
- LinkedIn: 6% see the best ROAS from LinkedIn.
- Snapchat: 0% see the best ROAS from Snapchat.
- Microsoft Ads (Bing): 1% see the best ROAS from Microsoft Ads (Bing).
- Pinterest: 0% see the best ROAS from Pinterest.
- Other: 2% selected “other” for the platform with the best ROAS.
UK businesses’ insights on their paid search (PPC) strategy
- 53% agree that their company is using the best keywords, ad groups, and account structure to help the campaign generate the greatest possible ROI, while 7% disagree, 28% are not sure, and 12% answered N/A.
- 45% agree that their search and social ads are not being seen by enough people, while 26% disagree, 18% are not sure, and 11% answered N/A.
- 41% agree that they know when and how to adjust bids/budgets to help the campaign generate the greatest possible ROI, while 14% disagree, 32% are not sure, and 13% answered N/A.
- 38% have seen an increase in CPC in their ads in the past 12 months, while 18% disagree, 25% are not sure, and 19% answered N/A.
- 23% have seen a decrease in CTR in their ads in the past 12 months, while 31% disagree, 26% are not sure, and 20% answered N/A.
- 33% have seen an increase in the cost of their Google Ads in the past 12 months, while 14% disagree, 22% are not sure, and 31% answered N/A.
- 17% have started advertising on Microsoft Ads in the past 12 months, while 32% disagree, 9% are not sure, and 42% answered N/A.
SEO Trends
Feel free to use and share our stats using the following attribution:
LOCALiQ UK State of Digital Marketing Report 2026
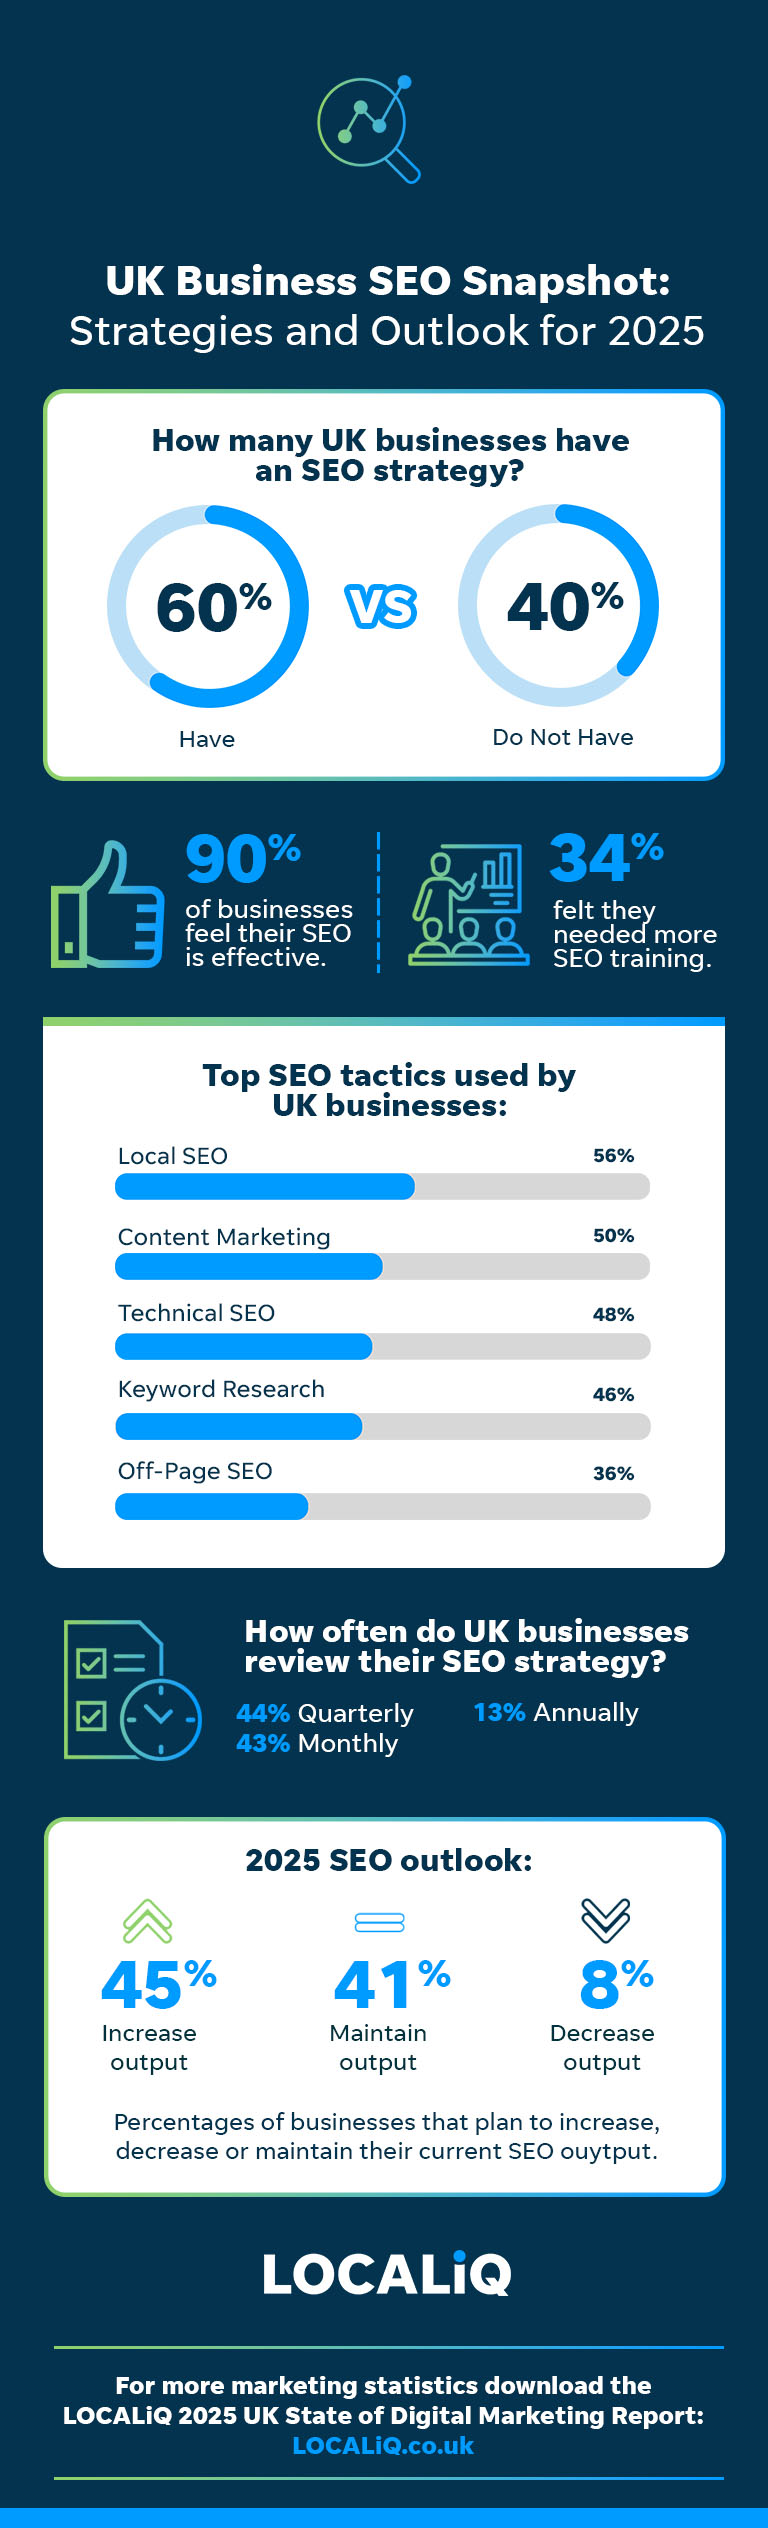
How many UK businesses use an SEO strategy in 2026?
- 41% reported their business has an SEO strategy.
- 59% reported their business does not have an SEO strategy.
Top SEO marketing tactics used by UK businesses
- Local SEO: 64% reported that Local SEO (e.g., optimising Google Business Profile, local citations, local reviews) is a part of their SEO strategy.
- Content Marketing: 60% reported that Content Marketing (e.g., blog posts, infographics, videos, whitepapers) is a part of their SEO strategy.
- Technical SEO: 53% reported that Technical SEO (e.g., website speed, mobile-friendliness, XML sitemaps) is a part of their SEO strategy.
- Keyword Research: 84% reported that Keyword Research (e.g., identifying high-traffic keywords, long-tail keywords, keyword difficulty analysis) is a part of their SEO strategy.
- Off-Page SEO: 38% reported that Off-Page SEO (e.g., Digital PR, link-building strategies, guest blogging) is a part of their SEO strategy.
- Competitor Analysis: 33% reported that Competitor Analysis (e.g., analysing competitors’ SEO strategies) is a part of their SEO strategy.
- On-Page SEO 64% reported that On-Page SEO (e.g., meta tags, URL structure, internal linking, image optimisation) is a part of their SEO strategy.
- Other: 2% reported that Other tactics are a part of their SEO strategy.
How often do UK businesses measure their SEO strategy?
- 39% review their SEO strategy quarterly.
- 41% review their SEO strategy monthly.
- 15% review their SEO strategy annually.
- 4% review their SEO strategy at other times.
Are SEO strategies effective?
- 84% believe their SEO strategy is effective.
- 16% believe their SEO strategy is not effective.
How do UK businesses manage their SEO?
- Google Search Console: 66% use Google Search Console to help manage their SEO.
- Google Analytics: 85% use Google Analytics to help manage their SEO.
- LOCALiQ SEO Audit: 24% use LOCALiQ SEO Audit to help manage their SEO.
- Semrush: 44% use Semrush to help manage their SEO.
- Moz: 15% use Moz to help manage their SEO.
- Yoast SEO: 20% use Yoast SEO to help manage their SEO.
- Ahrefs: 24% use Ahrefs to help manage their SEO.
- Ubersuggest 12% use Ubersuggest to help manage their SEO.
- Other tools: 7% use other tools to help manage their SEO.
- In-house: 67% manage their SEO strategy in-house.
- Agency: 33% use an agency to manage their SEO strategy.
How have AI overviews impacted SEO?
- 51% believe their clicks increased since the introduction of AI overviews, while 16% disagreed, 9% felt they stayed the same and 24% selected N/A.
- 43% feel their impressions increased since the introduction of AI overviews, while 23% disagreed, 9% felt they stayed the same and 25% selected N/A.
- 41% indicated their leads from organic search increased since the introduction of AI overviews, while 14% disagreed, 21% felt they stayed the same and 24% selected N/A.
Are UK businesses updating their SEO strategy to accommodate AI?
- 64% have adapted their SEO strategy to reflect the recent AI search changes.
- 36% have not adapted their SEO strategy to reflect the recent AI search changes.
SEO metrics used by UK businesses
- 81% are confident that they are using the right keywords for their SEO strategy, while 12% disagree and 7% selected N/A.
- 71% know how to effectively track where they rank for each keyword, while 23% disagree and 6% selected N/A.
- 68% understand fundamental Google guidelines, such as E-E-A-T, while 21% disagree and 11% selected N/A.
- 72% feel their SEO strategy gives them a fair shot at competing with larger, national companies, while 12% disagree and 16% selected N/A.
- 75% keep track of Google updates and know which ones have affected them, while 16% disagree and 9% selected N/A.
- 56% consider link-building to be a core part of their SEO strategy, while 33% disagree and 11% selected N/A.
- 64% feel ready to adapt their marketing strategy to future search changes (voice, AI, visual search), while 25% disagree and 11% selected N/A.
Website Marketing Stats
Website management approach
- Self-management: 73% manage and update their business website themselves.
- External management: 22% rely on an external webmaster or agency to manage and update their business website.
- No website: 5% do not have a website for their business.
Website traffic trends
- Increase: 51% have seen an increase in website traffic in the last twelve months.
- Decrease: 14% have seen an decrease in website traffic in the last twelve months.
- Stable: 20% have seen no change in website traffic in the last twelve months.
- Uncertain: 15% are not sure if they have seen an increase or decrease in website traffic in the last twelve months.
Website optimisation tools used by UK businesses
- Google Analytics: 80% use Google Analytics to help manage or optimise their website.
- Google Search Console: 43% use Google Search Console to help manage or optimise their website.
- WordPress: 39% use WordPress to help manage or optimise their website.
- Shopify: 10% use Shopify to help manage or optimise their website.
- Hotjar: 10% use Hotjar to help manage or optimise their website.
- LOCALiQ Website Grader: 12% use LOCALiQ Website Grader to help manage or optimise their website.
- Wix: 12% use Wix to help manage or optimise their website.
- Microsoft Clarity: 14% use Microsoft Clarity to help manage or optimise their website.
- Other tools: 9% use “other tools” to help manage or optimise their website.
Content Marketing Trends
Feel free to use and share our stats using the following attribution:
LOCALiQ UK State of Digital Marketing Report 2026
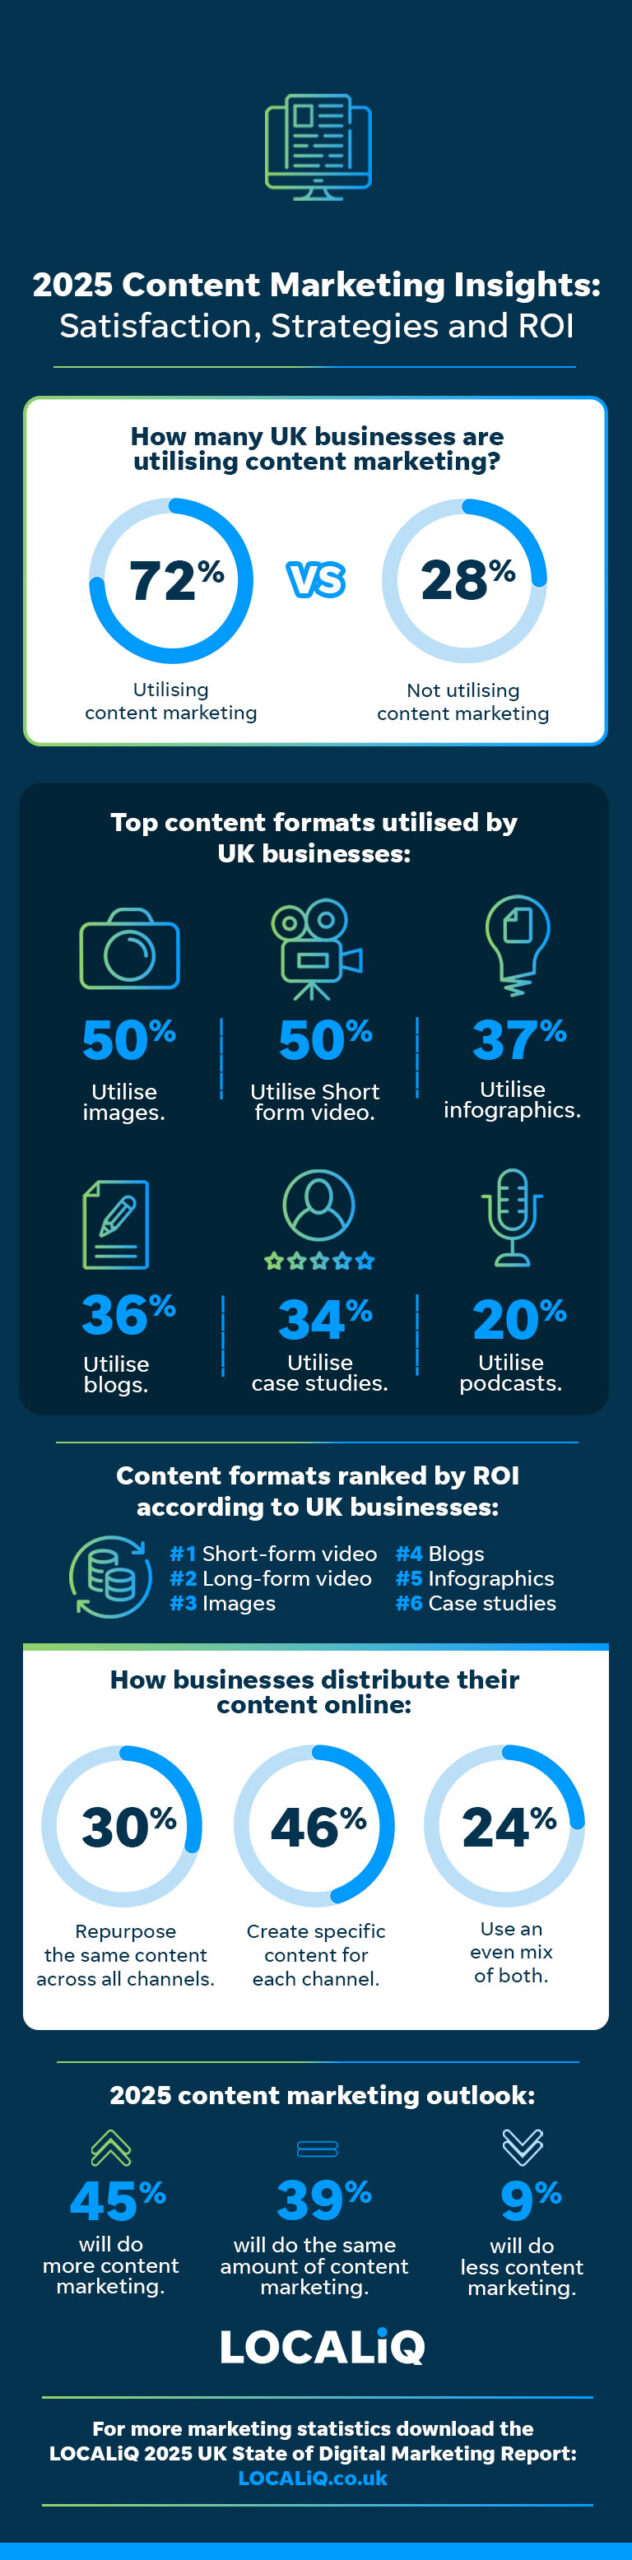
Content marketing strategy
- 65% use content marketing as part of their current strategy.
- 35% do not use content marketing as part of their current strategy.
Most used content formats by UK businesses
- Images: 79% use images as part of their content strategy.
- Short-form video: 64% use short-form video as part of their content strategy.
- Long-form video: 24% use long-form video as part of their content strategy.
- Infographics: 39% use infographics as part of their content strategy.
- Blogs: 60% use blogs as part of their content strategy.
- Case studies: 47% use case studies as part of their content strategy.
- Newsletter: 61% use newsletters as part of their content strategy.
- Podcasts: 13% use podcasts as part of their content strategy.
- Webinars: 16% use webinars as part of their content strategy.
- Other content formats: 0% use other content formats as part of their content strategy.
AI in Marketing Trends
Feel free to use and share our stats using the following attribution:
LOCALiQ UK State of Digital Marketing Report 2026
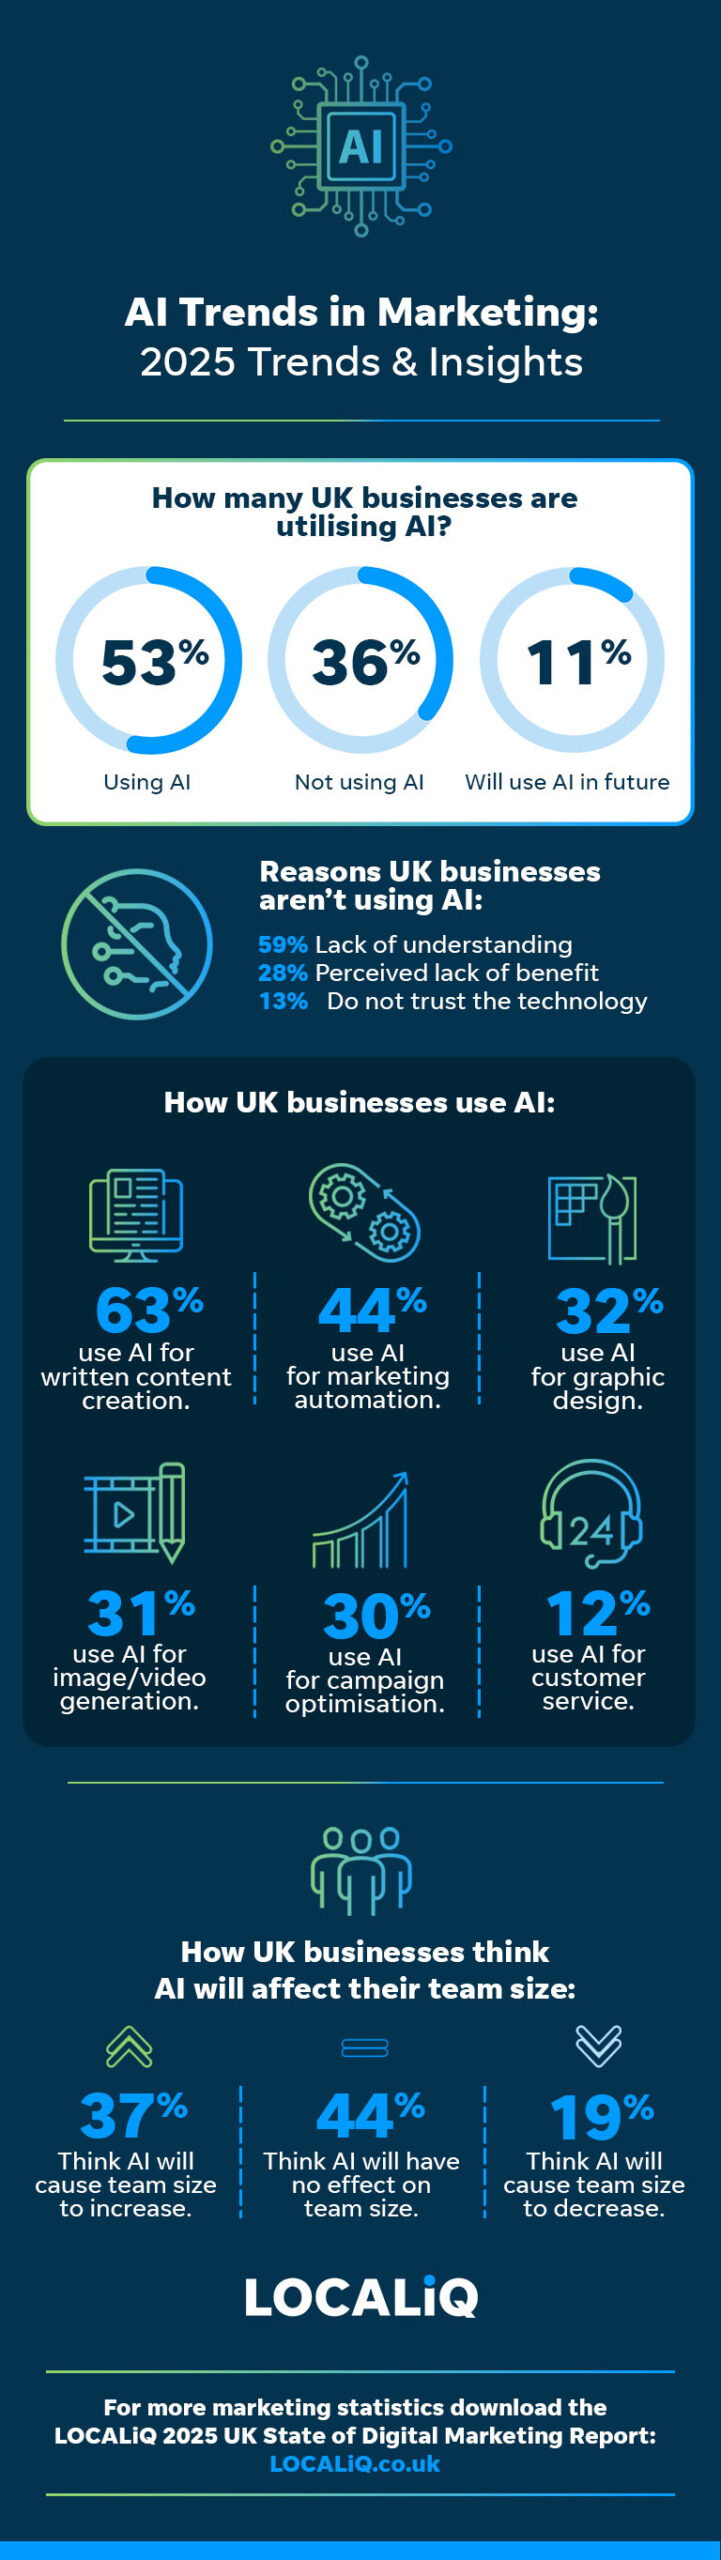
Use of AI in marketing
- Using AI: 50% are currently utilising AI in their marketing strategy.
- Not using AI: 36% are not currently utilising AI in their marketing strategy.
- Plan to use in future: 14% are not currently utilising AI, but will use AI in their marketing strategy in the future.
AI usage across various marketing categories
- Written content creation: 90% are using AI for written content creation.
- Marketing automation: 35% are using AI for marketing automation.
- Graphic design: 37% are using AI for graphic design.
- Image/video generation: 39% are using AI for image/video generation.
- Campaign optimisation: 37% are using AI for campaign optimisation.
- Customer service: 20% are using AI for customer service.
- Other aspects: 8% are using AI for other aspects of digital marketing.
Most popular AI tools for UK businesses
- Google Bard/Gemini: 29% are using Google Bard/Gemini as an AI tool.
- ChatGPT: 83% are using ChatGPT as an AI tool.
- Bing AI/Co-Pilot: 27% are using Bing AI/Co-Pilot as an AI tool.
- CapCut: 37% are using CapCut as an AI tool.
- DALL·E: 17% are using DALL·E as an AI tool.
- Midjourney: 12% are using Midjourney as an AI tool.
- Zapier: 17% are using Zapier as an AI tool.
- Adobe Firefly: 15% are using Adobe Firefly as an AI tool.
- Copy.AI: 15% are using Copy.AI as an AI tool.
- GrammarlyGO: 15% are using GrammarlyGO as an AI tool.
- Other AI tools: 6% are using “other” AI tools.
Advantages of AI in business
- 59% feel that AI has helped their business by increasing the volume of marketing output.
- 52% feel that AI has helped their business by improving the quality of marketing output.
- 28% feel that AI has helped their business by reducing costs.
- 32% feel that AI has helped their business by bridging skill gaps.
- 63% feel that AI has helped their business with idea generation.
- 32% reported that AI has helped their business reach marketing goals quickly.
- 28% stated that AI has helped their business by supporting revenue generation or improving sales performance.
Why do some businesses avoid AI?
- Lack of understanding: 60% who are not utilising AI stated they don’t understand the technology enough to comfortably use it.
- Perceived lack of benefit: 20% who are not utilising AI said that they don’t feel they’d benefit from using it.
- Trust issues with technology: 20% who are not utilising AI mentioned that they don’t fully trust the technology.
How many UK businesses test new AI tools?
- 47% regularly test new AI tools.
- 53% do not regularly test new AI tools.
How many UK businesses budget for AI?
- 30% have budgeted for AI technologies in 2026.
- 70% have not budgeted for AI technologies in 2026.
Expected impact of AI on marketing teams/roles
- Expansion of team: 15% agreed their team size increased due to AI, while 85% disagreed.
- Team size reduction: 18% agreed their team size had reduced due to AI, while 82% disagreed.
- Job role: 27% agreed their job role has changed due to AI, while 73% disagreed.
- Career path: 30% agreed their career path looks different due to AI, while 70% disagreed.
- Marketing salaries: 27% agreed their marketing salaries are now lower due to AI, while 73% disagreed.
- Career progression: 35% agreed they feel less confident about long-term career progression in marketing due to AI, while 65% disagreed.
- AI automation: 35% agreed their current role could be partially or fully automated by AI, while 65% disagreed.
How many UK businesses trust AI?
- 62% trust AI more than they did last year.
- 38% trust AI less than they did last year.
UK businesses’ general thoughts on AI
-
- Source credits: 28% agreed that AI-generated content fairly credits its sources, while 44% disagreed, and 28% are unsure.
- Protected content: 71% agreed there should be more regulations to protect their content from being used in AI-generated content, while 12% disagreed, and 17% are unsure.
- Brand authenticity: 58% agreed that AI-generated content can negatively affect brand authenticity, while 22% disagreed, and 20% are unsure.
- AI content creation: 51% agreed that consumers can tell when AI has been used to create content, while 24% disagreed, and 25% are unsure.
- AI content avoidance: 38% agreed they avoid using AI-generated content, while 44% disagreed, and 18% are unsure.
- AI creativity concerns: 56% agreed they are concerned about an over-reliance on AI-generated content, while 30% disagreed, and 14% are unsure.
- AI tools: 37% agreed they have an internal policy around the use of AI tools, while 47% disagreed, and 16% are unsure.
Google’s AI Overviews Experience
- 29% believe Google’s AI Overviews offer enough credit to websites and content creators.
- 32% believe Google’s AI Overviews do not offer enough credit to websites and content creators.
- 39% stated they don’t know what Google’s AI Overviews are.
Digital Marketing Trends – Challenges
Challenges in digital marketing for 2026
-
- Inadequate budget: 52% identified inadequate budget as one of their biggest challenges to digital marketing success.
- Keeping up with new trends: 36% cited keeping up with new trends as a key challenge to digital marketing success.
- Understanding and defining target audience: 18% pointed to understanding and defining their target audience as a major obstacle to digital marketing success.
- Increasing competition: 33% ranked increasing competition as one of their top challenges to digital marketing success.
- Coordination across marketing channels: 15% mentioned coordination across marketing channels (email, social, display, etc.) as a challenge to digital marketing success.
- Lack of training and experience: 32% struggled with a lack of training and experience in digital marketing.
- Understanding user intent: 27% found understanding user intent for better conversions to be a challenge to digital marketing success.
- Accessing and leveraging customer data: 23% faced difficulty accessing and leveraging customer data from multiple channels and data sources.
- Lack of innovation and creativity: 22% identified a lack of innovation and creativity as a challenge to digital marketing success.
- Lack of an effective strategy: 34% felt that a lack of an effective strategy was a major challenge to digital marketing success.
- Unclear data from analytics: 27% encountered unclear data from analytics as a challenge to digital marketing success.
- Sales and marketing alignment issues: 19% faced sales and marketing alignment issues in digital marketing.
- Lacking marketing software: 17% reported lacking marketing software as a challenge to digital marketing success.
- Unable to prove ROI: 23% were unable to prove ROI as one of the obstacles to digital marketing success.
- Challenges with idea generation: 24% faced challenges with idea generation in digital marketing.
- Channel attribution struggles: 13% struggled with channel attribution in digital marketing.
Internal obstacles
- Lack of resources: 32% identified lack of resources (such as budget and the inability to expand teams through hiring) as a key challenge to their digital marketing efforts.
- Lack of time/time-management: 51% considered lack of time/time-management as the biggest internal challenge to their digital marketing efforts.
Desired tactics but limited by resources/skills
- SEO (Search Engine Optimisation): 38% would like to implement SEO (Search Engine Optimisation) into their strategy, but lack the resources or skills required.
- Social Media Marketing: 28% would like to implement Social Media Marketing into their strategy, but lack the resources or skills required.
- Email Marketing: 19% would like to implement Email Marketing into their strategy, but lack the resources or skills required.
- Data Analysis: 16% would like to implement Data Analysis into their strategy, but lack the resources or skills required.
- Content Marketing: 19% would like to implement Content Marketing into their strategy, but lack the resources or skills required.
- Use of AI: 24% would like to implement AI into their strategy, but lack the resources or skills required.
- Paid Search (PPC): 20% would like to implement Paid Search (PPC) into their strategy, but lack the resources or skills required.
- Project Management: 16% would like to implement Project Management into their strategy, but lack the resources or skills required.
- Budget Management: 20% would like to implement Budget Management into their strategy, but lack the resources or skills required.
- Video Editing: 26% would like to implement Video Editing into their strategy, but lack the resources or skills required.
- Marketing Automation: 25% would like to implement Marketing Automation into their strategy, but lack the resources or skills required.
- CRM Management: 20% would like to implement CRM Management into their strategy, but lack the resources or skills required.
- Podcast Creation: 22% would like to implement Podcast Creation into their strategy, but lack the resources or skills required.
- Website Maintenance Experience: 16% would like to implement Website Maintenance Experience into their strategy, but lack the resources or skills required.
- Digital PR Experience: 16% would like to implement Digital PR into their strategy, but lack the resources or skills required.
- Data Analysis: 11% would like to implement Data Analysis into their strategy, but lack the resources or skills required.
- Webinar Creation: 13% would like to implement Webinar Creation into their strategy, but lack the resources or skills required.
- Graphic Design: 19% would like to implement Graphic Design into their strategy, but lack the resources or skills required.
- Online Listing Management: 17% would like to implement Online Listing Management into their strategy, but lack the resources or skills required.
- In-Person Events: 15% would like to implement In-Person Events into their strategy, but lack the resources or skills required.
Marketing Budget Trends
Marketing budget distribution
- 20% have an annual marketing budget of less than £1,000.
- 21% have an annual marketing budget of £1,000 to £4,999.
- 13% have an annual marketing budget of £5,000 to £9,999.
- 10% have an annual marketing budget of £10,000 to £24,999.
- 7% have an annual marketing budget of £25,000 to £49,999.
- 8% have an annual marketing budget of £50,000 to £119,999.
- 9% have an annual marketing budget of £120,000 or more.
- 11% are unsure about their annual marketing budget and selected Don’t Know.
2026 Marketing Goals
Planned efforts for each marketing channel
- Organic Social Media: 69% of marketing professionals plan to grow their efforts, 23% plan to maintain them, 4% plan to reduce them, and 4% say it is not applicable to their strategy.
- Paid Social Media Advertising: 41% of marketing professionals plan to grow their efforts, 41% plan to maintain them, 3% plan to reduce them, and 15% say it is not applicable to their strategy.
- SEO (Search Engine Optimisation): 67% of marketing professionals plan to grow their efforts, 26% plan to maintain them, 1% plan to reduce them, and 6% say it is not applicable to their strategy.
- Search Marketing (PPC): 41% of marketing professionals plan to grow their efforts, 34% plan to maintain them, 5% plan to reduce them, and 20% say it is not applicable to their strategy.
- Content Marketing: 61% of marketing professionals plan to grow their efforts, 25% plan to maintain them, 1% plan to reduce them, and 13% say it is not applicable to their strategy.
- Website Upgrades/Maintenance: 52% of marketing professionals plan to grow their efforts, 32% plan to maintain them, 5% plan to reduce them, and 11% say it is not applicable to their strategy.
- Display Advertising: 29% of marketing professionals plan to grow their efforts, 40% plan to maintain them, 7% plan to reduce them, and 24% say it is not applicable to their strategy.
- Online Directories/Listings: 32% of marketing professionals plan to grow their efforts, 37% plan to maintain them, 9% plan to reduce them, and 22% say it is not applicable to their strategy.
- Print Advertising: 23% of marketing professionals plan to grow their efforts, 40% plan to maintain them, 16% plan to reduce them, and 21% say it is not applicable to their strategy.
- Video Marketing: 60% of marketing professionals plan to grow their efforts, 23% plan to maintain them, 2% plan to reduce them, and 15% say it is not applicable to their strategy.
- Digital PR: 51% of marketing professionals plan to grow their efforts, 23% plan to maintain them, 6% plan to reduce them, and 20% say it is not applicable to their strategy.
Planned changes in marketing tactics
- Pre-Produced Long-Form Video: 32% are currently utilising this and plan to do more, 7% are using it but plan to do less, 35% are not currently using it but would like to, and 26% do not plan to use it in 2025.
- Pre-Produced Short-Form Video: 46% are currently utilising this and plan to do more, 14% are using it but plan to do less, 26% are not currently using it but would like to, and 14% do not plan to use it in 2025.
- Livestream Video: 21% are currently utilising this and plan to do more, 7% are using it but plan to do less, 32% are not currently using it but would like to, and 40% do not plan to use it in 2025.
- Influencer Marketing: 18% are currently utilising this and plan to do more, 7% are using it but plan to do less, 27% are not currently using it but would like to, and 48% do not plan to use it in 2025.
- Interactive Content: 27% are currently utilising this and plan to do more, 7% are using it but plan to do less, 43% are not currently using it but would like to, and 23% do not plan to use it in 2025.
- User-Generated Content: 25% are currently utilising this and plan to do more, 8% are using it but plan to do less, 37% are not currently using it but would like to, and 30% do not plan to use it in 2025.
- Virtual Customer Communities: 15% are currently utilising this and plan to do more, 6% are using it but plan to do less, 21% are not currently using it but would like to, and 58% do not plan to use it in 2025.
- Pre-Produced Audio: 27% are currently utilising this and plan to do more, 7% are using it but plan to do less, 25% are not currently using it but would like to, and 41% do not plan to use it in 2025.
- Live Audio: 22% are currently utilising this and plan to do more, 5% are using it but plan to do less, 19% are not currently using it but would like to, and 54% do not plan to use it in 2025.
- Virtual Experiences: 19% are currently utilising this and plan to do more, 3% are using it but plan to do less, 29% are not currently using it but would like to, and 49% do not plan to use it in 2025.
- Webinars: 28% are currently utilising this and plan to do more, 7% are using it but plan to do less, 19% are not currently using it but would like to, and 46% do not plan to use it in 2025.
- In-Person Events: 47% are currently utilising this and plan to do more, 12% are using it but plan to do less, 15% are not currently using it but would like to, and 26% do not plan to use it in 2025.
- Social Media DMs for Customer Service: 34% are currently utilising this and plan to do more, 9% are using it but plan to do less, 26% are not currently using it but would like to, and 31% do not plan to use it in 2025.
- AI for Content Creation: 45% are currently utilising this and plan to do more, 3% are using it but plan to do less, 19% are not currently using it but would like to, and 33% do not plan to use it in 2025.
- AI for Marketing Automation: 37% are currently utilising this and plan to do more, 8% are using it but plan to do less, 22% are not currently using it but would like to, and 33% do not plan to use it in 2025.
- Multi/Omni-Channel Marketing: 33% are currently utilising this and plan to do more, 8% are using it but plan to do less, 22% are not currently using it but would like to, and 37% do not plan to use it in 2025.
- AI for Customer Service (Chatbots, ChatGPT-Generated Responses): 26% are currently utilising this and plan to do more, 3% are using it but plan to do less, 20% are not currently using it but would like to, and 51% do not plan to use it in 2025.
UK businesses’ general thoughts on marketing
-
- 76% feel marketing has become more challenging in the past 12 months, while 24% disagree.
- 60% are more confident in their marketing strategy this year compared to last year, while 40% disagree.
- 54% believe they can track marketing performance more efficiently than last year, while 46% disagree.
- 56% feel overwhelmed by the pace of change in marketing, while 44% disagree.
Future Plans in Digital Advertising
Planned marketing spending in the next twelve months
- Meta/Facebook: 40% plan to increase spending on Meta/Facebook, while 7% plan to decrease it, 31% will maintain spending, 17% say it doesn’t apply, and 5% are unsure.
- Instagram: 33% plan to increase spending on Instagram, while 7% plan to decrease it, 28% will maintain spending, 25% say it doesn’t apply, and 7% are unsure.
- YouTube: 21% plan to increase spending on YouTube, while 5% plan to decrease it, 16% will maintain spending, 45% say it doesn’t apply, and 13% are unsure.
- X/Twitter: 11% plan to increase spending on X/Twitter, while 4% plan to decrease it, 18% will maintain spending, 59% say it doesn’t apply, and 8% are unsure.
- TikTok: 19% plan to increase spending on TikTok, while 4% plan to decrease it, 10% will maintain spending, 54% say it doesn’t apply, and 13% are unsure.
- LinkedIn: 31% plan to increase spending on LinkedIn, while 6% plan to decrease it, 20% will maintain spending, 31% say it doesn’t apply, and 12% are unsure.
- Pinterest: 8% plan to increase spending on Pinterest, while 10% plan to decrease it, 9% will maintain spending, 65% say it doesn’t apply, and 8% are unsure.
- Snapchat: 6% plan to increase spending on Snapchat, while 6% plan to decrease it, 11% will maintain spending, 65% say it doesn’t apply, and 12% are unsure.
- Google: 48% plan to increase spending on Google, while 3% plan to decrease it, 23% will maintain spending, 17% say it doesn’t apply, and 9% are unsure.
- Bing: 20% plan to increase spending on Bing, while 3% plan to decrease it, 13% will maintain spending, 47% say it doesn’t apply, and 17% are unsure.
Planned marketing actions for the upcoming twelve months
- Increased Digital Ad Spend: 60% of marketing professionals plan to spend more on digital advertising in the next twelve months than they did last year.
- Expanding In-House Teams: 30% of marketing professionals plan to expand their in-house marketing team to manage their digital marketing better.
- More Creative Automation: 38% of marketing professionals plan to use more creative automation in the future.
- Investing in Digital Tools and Tech: 30% of marketing professionals plan to invest more in digital advertising tools and technology over the next year.
- Outsourcing Digital Advertising: 16% of marketing professionals plan to outsource digital advertising more in the next twelve months.
- AI in Marketing Strategy: 38% of marketing professionals plan to incorporate AI into their marketing strategy.
- AI-Generated Search Results: 32% of marketing professionals plan to focus on appearing in AI-generated search results over the next year.
Are you keen to compare these stats with 2025? View last year’s stats in our blog below:
2025 UK Digital Marketing Statistics

Related Articles

What Is the Average CTR for Google Ads?

Google Introduces AI Mode to UK Users: Here’s What You Should Know

2025 Digital Marketing Statistics from UK Marketing Professionals
7 Ways to Demonstrate the Value of Your School Through Video Marketing
LOCALiQ Announced as Finalists in Three Categories at 2024 Search Engine Land Awards